Effect of Lockdown on Cycle and Motor Traffic Flows
Report by Prof Bruce Lynn, Healthy Rides Co-ordinator, Southwark Cyclists, London Cycling Campaign. Version 10/6/20.
Key points
Data collected on A200, Jamaica Rd, Dockhead. Past data Oct 2012 to January 2020. New data from 10 April to 10th June 2020. Manual counts.
Past data was principally peak hour. Interpeak data calculated from TfL data on time distribution for Central London counts, 2017, Travel in London, Report 11, Fig 5.4
Average Daily Cycle Flows
Pre During % change
Weekday 6050 4055 -33%
Weekend 2042* 6160 +202%
* Ratio Sat/Sun to Weekday, 0.30. Used to estimate pre weekend flow. 0.3 factor comes from Transport for London Surface Transport Traffic Analysis Centre. TAC Traffic Note 3 – TfL Cordon and Screenline Surveys 1971-2011, http://content.tfl.gov.uk/traffic-note-3-cordon-and-screenline-surveys-2011.pdf
Peak hour cycle flows (per hour)
Pre During % change
Weekday pm 838 490 -42%
Weekday am 963 240 -75%
Weekend n/a 650
Report by Prof Bruce Lynn, Healthy Rides Co-ordinator, Southwark Cyclists, London Cycling Campaign. Version 10/6/20.
Key points
- Weekend cycling up 200% with 60-70% mode share.
- Working week cycling down 33%, but slowly rising. Motor traffic down 35% and stable.
- % female cyclists is sig up on pre-lockdown
- Commuter “transport” cycling (as opposed to “leisure” cycling) is possibly down by as much as 70%.
- So some good, some bad news here. Leaves open the question of whether routine “transport” cycling will even recover to pre-lockdown levels when there is a full return to work and motor traffic increases.
Data collected on A200, Jamaica Rd, Dockhead. Past data Oct 2012 to January 2020. New data from 10 April to 10th June 2020. Manual counts.
Past data was principally peak hour. Interpeak data calculated from TfL data on time distribution for Central London counts, 2017, Travel in London, Report 11, Fig 5.4
Average Daily Cycle Flows
Pre During % change
Weekday 6050 4055 -33%
Weekend 2042* 6160 +202%
* Ratio Sat/Sun to Weekday, 0.30. Used to estimate pre weekend flow. 0.3 factor comes from Transport for London Surface Transport Traffic Analysis Centre. TAC Traffic Note 3 – TfL Cordon and Screenline Surveys 1971-2011, http://content.tfl.gov.uk/traffic-note-3-cordon-and-screenline-surveys-2011.pdf
Peak hour cycle flows (per hour)
Pre During % change
Weekday pm 838 490 -42%
Weekday am 963 240 -75%
Weekend n/a 650
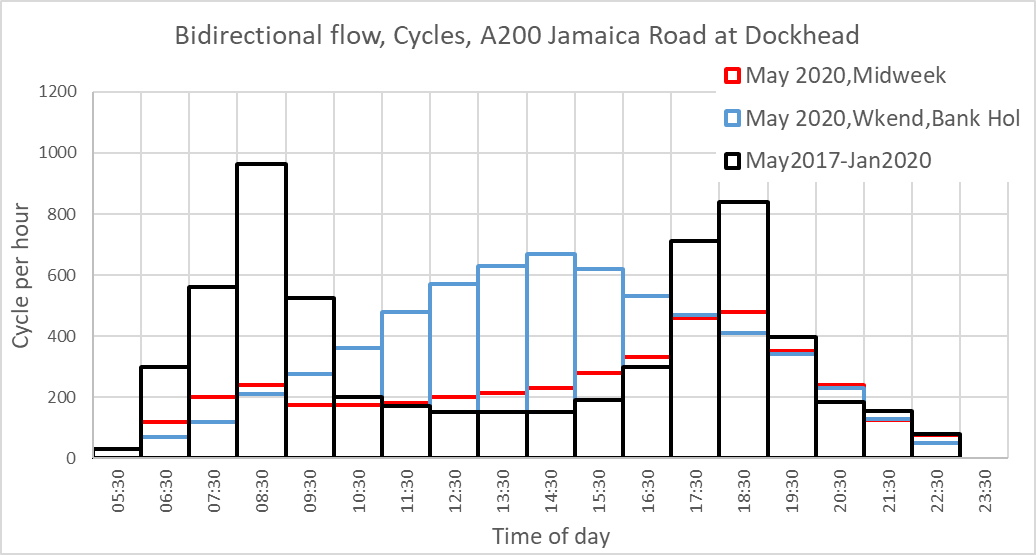
Note unusual time course of midweek flow. Morning peak almost lost. See last section below for more discussion.
Cycling mode share (% total traffic).
Midweek at peaks pre lockdown, cycle mode share =>50%. Peak mode share during lockdown was only 30% at end April, beginning May, but has risen to 35% am and 55-60% pm. At weekends during the middle of the afternoon cycle mode share is 60-70% on good weather days.
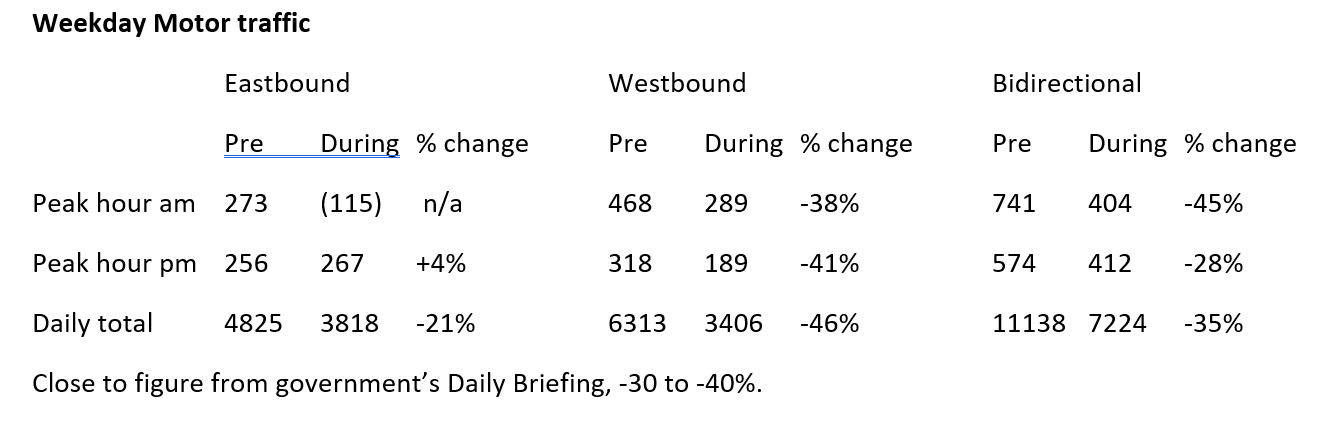
East v West flows.
Weekdays. Pre lockdown flow pattern was VERY tidal, am peak Westbound ca 10 times eastbound flow. At pm peak, eastbound >> westbound. During lockdown, E/W diffs not so marked, but still trend for greatest west flows am and east flows pm.
Trends over time.
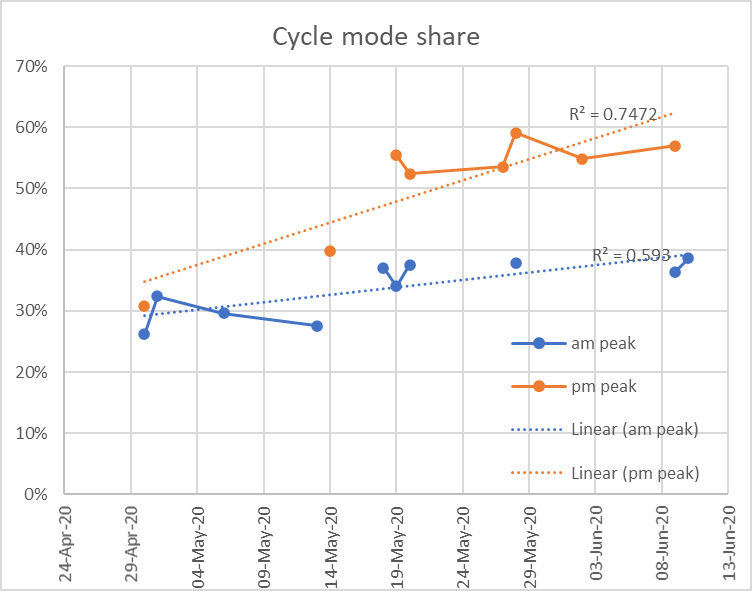
Cycle flows. Sig linear slope. Pm peak, eastbound, gone from 35% to 60% mode share. Am peak westbound 30% to 40%. Motor flows show small, just sig upward trend. Includes data to 10th June.
Cycling mode share (% total traffic).
Midweek at peaks pre lockdown, cycle mode share =>50%. Peak mode share during lockdown was only 30% at end April, beginning May, but has risen to 35% am and 55-60% pm. At weekends during the middle of the afternoon cycle mode share is 60-70% on good weather days.
East v West flows.
Weekdays. Pre lockdown flow pattern was VERY tidal, am peak Westbound ca 10 times eastbound flow. At pm peak, eastbound >> westbound. During lockdown, E/W diffs not so marked, but still trend for greatest west flows am and east flows pm.
Trends over time.
Cycle flows. Sig linear slope. Pm peak, eastbound, gone from 35% to 60% mode share. Am peak westbound 30% to 40%. Motor flows show small, just sig upward trend. Includes data to 10th June.
Male/female differences
2018 data am only 18.1% female riders. 7-9 am, weekday.
During lockdown 25.0%, same time weekday, sig higher proportion (p=.02).
For comparison, Q1 (pm peak) pre lockdown was 25.3%, close to lockdown Jamaica Rd value.
Weekend cycling during lockdown 34.6% female, sig higher than weekday (27.1%, all times).
Strong evidence for more female cyclists during lockdown. Increase at busy times weekday indicates new female cyclists OK on busier roads during lockdown. Note motor traffic down 35% (see above), but that is still over 400 veh/hour most of the time during working week.
How much midweek cycling is for transport, how much leisure?
The shape of the time of day profile during lockdown is very different from pre-lockdown (see chart at start). Peak flows are depressed, particularly am. Flows during the day are if anything slightly up. Likely what we are seeing is a lot of “weekend” leisure cycling all week. Tried modelling flow profile for a weighted sum of pre lockdown and lockdown weekend profiles.
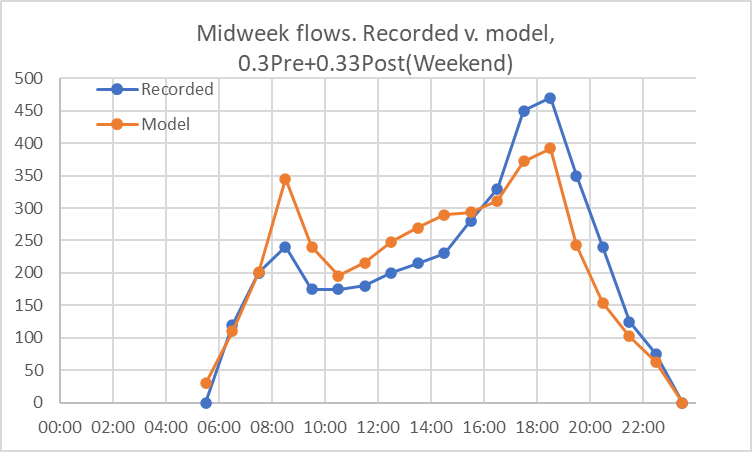
Least square fit was for recorded lockdown weekday profile was 33% of weekend flow plus 30% of pre-lockdown flow. Fit is not very good. But indicates that cycling for transport may be only 30% of pre-lockdown levels. Flows at peak are rising, but need to be cautious in interpreting the total weekday flow as transport flow. If cycling to work, to school etc is to contribute significantly to London’s workday travel we need to see a massive rise in weekday cycling. So far the data indicate probably recovery to pre-lockdown levels, but not the 10-fold increase hoped for by some campaigners and politicians.
This report as Word doc below
| lockdown_flows_summaryv02.docx |
 RSS Feed
