Right click to view a larger image
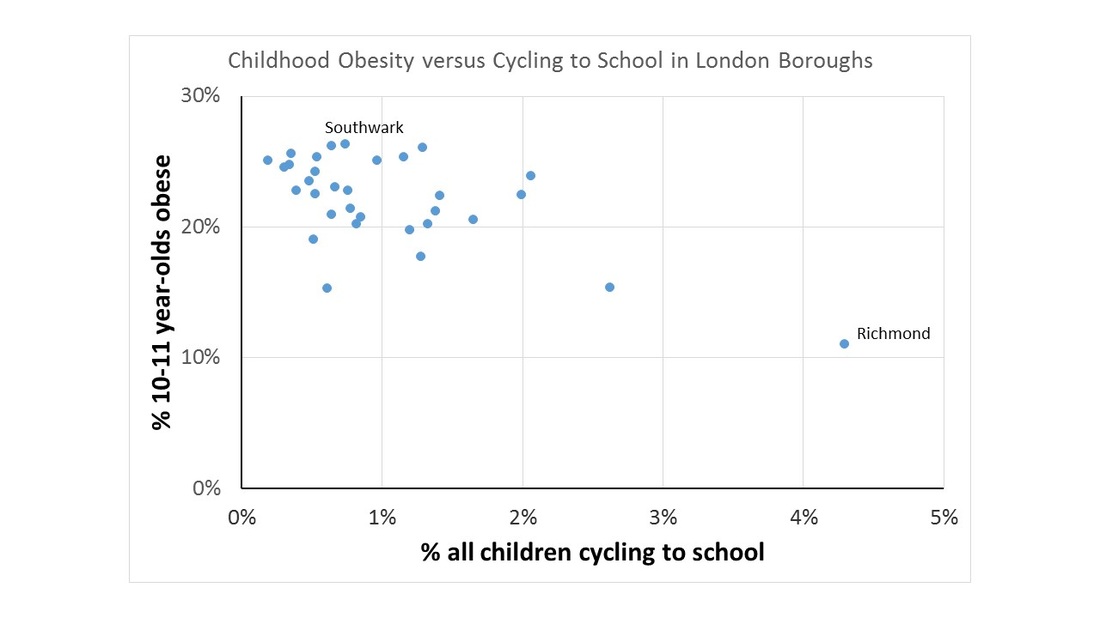
Recent data from Public Health England (Children, Young People and families NCMP Dataset) assign Southwark the doubtful honour of having the fattest 10-11 year olds in the whole of England. This may in part be because Southwark has very few children cycling to school (0.7%, Dept of Education, SCHOOLS, PUPILS, AND THEIR CHARACTERISTICS, JANUARY 2011).
The graph above shows levels of children's obesity plotted against cycling to school for all London boroughs. There is a clear negative relation. The more cycling, the less obesity.
Now we should not think all excess body weight is due to lack of cycling. But some of it probably is. There are clearly important common features that may account for some of the relation. For example better off families tend to exercise more and be less likely to be obese. And Richmond probably has a lot more better off families than Southwark.
But this clear relationship should make you think. Just maybe it is time for a serious effort to get our children cycling to and from school.
 RSS Feed
