Which boroughs have most cyclists?
Census data provides numbers on people whose main mode of transport to work is cycling (see my blog on this). Data is also collected annually by Sport England's Active People Survey. This is a phone survey mostly about participation in sport, but also includes some questions about all cycling. Key questions ask how many days in the last 28 you have cycled for any reason. Duration of cycling needs to have been 30 min or more. Usually 500 people in every English local authority area are sampled. So the samples are small, but over the 5 surveys published so far (covering 2005-6 to 20010-2011) this means we now have samples of 3-4000, big enough to be statistically useful for comparisons between boroughs.
Key data is in the 2 diagrams below.
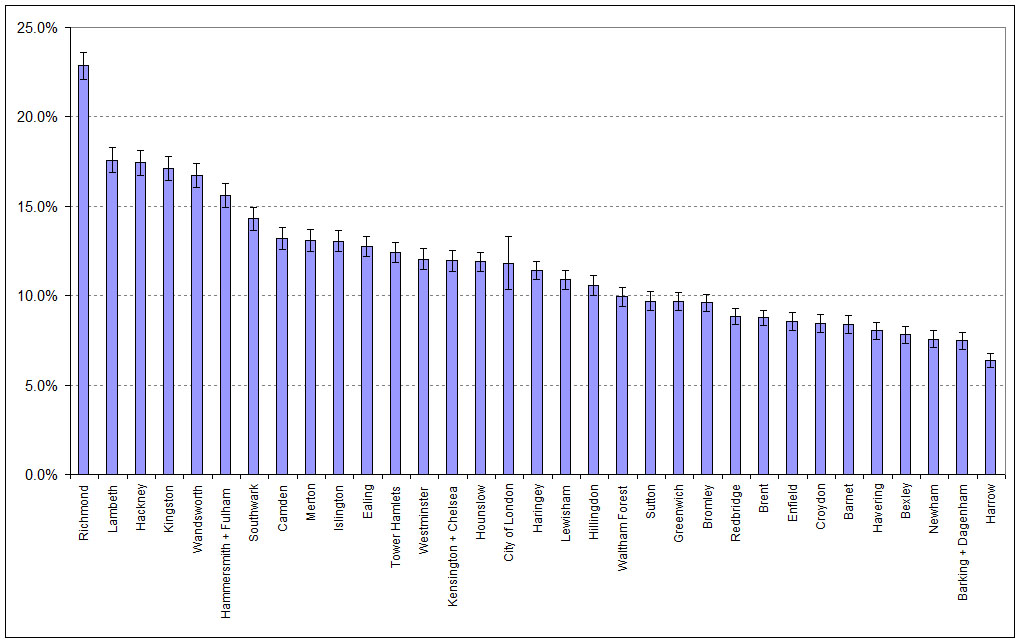
Proportion of people cycling at least once in last 4 weeks, for duration of 30 min or more.
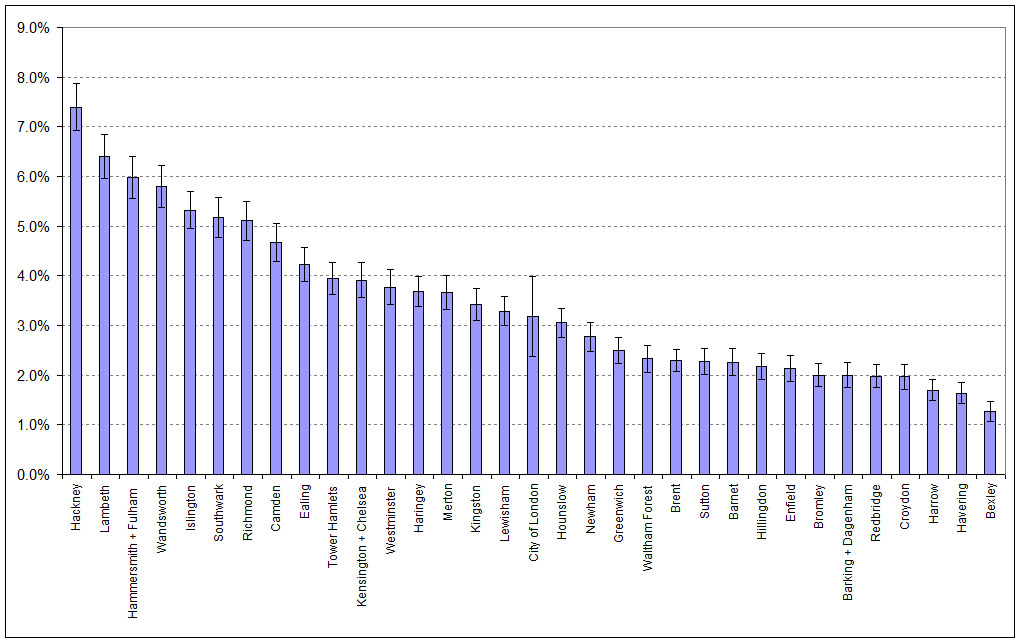
Proportion of people cycling at least 12 times in the last 4 weeks
For those doing at least 1 ride per month, the clear winner is Richmond, where over the period from 2005-2011 23% of adults cycled once a month or more. Note that this is for all ages and both genders. For males aged 16-54 an impressive 34% cycled once a month. In the last 2 years available, 2009-2011, this had risen to 39%. If every Borough were like Richmond, I think we would have cracked it! In contrast, most outer boroughs had less than 10% cycling once a month.
For regular cyclists doing at least 3 rides of 30 min duration per week, probably mostly cycling to work, the picture is interestingly different. The outer boroughs have rather low numbers again. Amongst the inner boroughs, by far the best is Hackney with 7.4% cycling 3 times a week or more.
It is possible to look at trends over the period 2005-2011. However, the number each year in individual boroughs are small. Basically no significant trends are apparent. For London as a whole the number cycling once a month has increased from 11.2 to 11.6% while the number cycling 3 times per week has fallen from 3.4 to 3.3%. Neither of these trends is statistically significant. However, this negative finding is interesting. Roadside counts of cyclists in London over the same period have risen substantially. So it looks as though this rise is due to the same number of cyclists covering more miles, not new cyclists joining the ranks.
Data for graphs is available below. Anyone wanting more info is welcome to contact me ([email protected]).
| borough_summary.xls |
